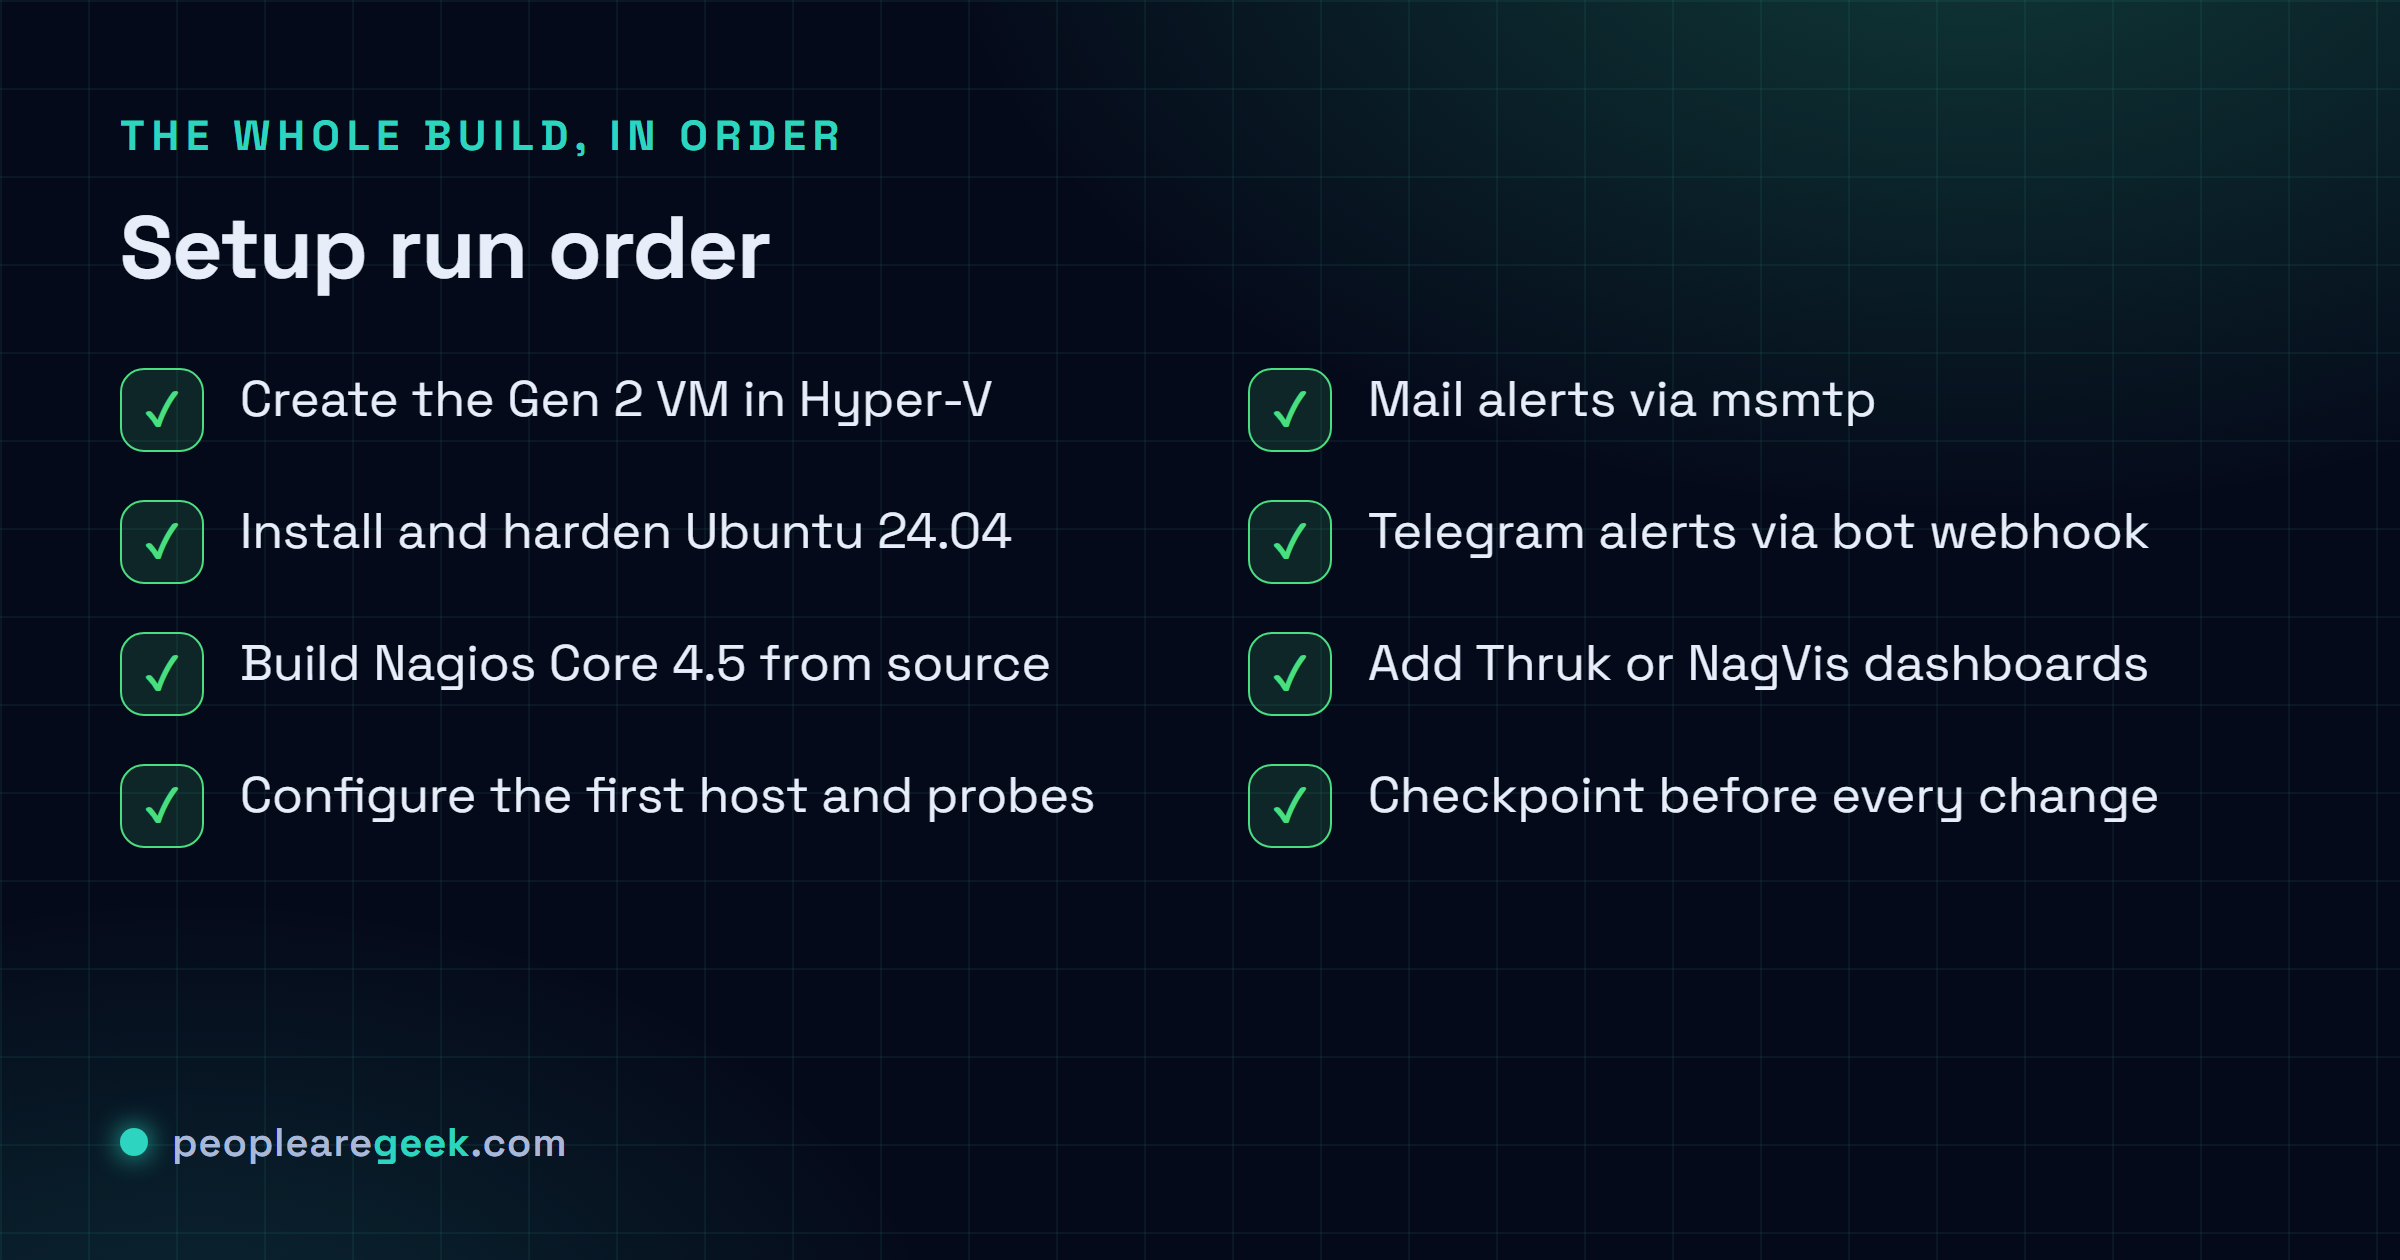
Server monitoring with Nagios on Hyper-V still earns its keep in 2026, and this is the whole build start to finish. Spin up an Ubuntu 24.04 VM, build Nagios Core 4.5 from source, point probes at HTTP, SSH, MySQL and disk, then wire mail plus Telegram so the alerts actually find you. Hyper-V buys you checkpoints to roll back, a VHDX that rides inside the backup you already run, and a watcher that lives apart from the things it watches. Budget two to three hours for the first build on a clean VM. After that, adding a host is a five-minute job.
The short answer
Run Nagios Core on a Hyper-V VM: a Generation 2 Ubuntu 24.04 box, Nagios 4.5
built from the official tarball, one config file per host, and check_http /
check_ssh / check_tcp / check_disk probes aimed at your fleet. Alerts go
out by msmtp mail and a Telegram bot, and a checkpoint before every change
is your undo button.

Nagios Core is the dull one. The workhorse I keep crawling back to. It's been watching datacenter floors since 1999, and somehow, in 2026, it still earns its keep in plenty of small and mid-size shops. Mine too. I run it as a VM on Hyper-V (Windows Server, or Windows 11 Pro with the Hyper-V role switched on), and honestly that setup buys me things I care about more than I probably should: a monitoring box that costs nothing extra, snapshots I can roll back when I break something. The VHDX rides along in the backup I already run. And the watcher lives apart from the things it's watching. This walks the whole thing, start to finish. Spin up the VM, drop Ubuntu 24.04 inside, build Nagios, aim probes at HTTP / SSH / MySQL / disk, then wire mail and Telegram so the alerts actually find you. The maintenance habits come last, because those are what keep the box honest instead of quietly lying to your face. Budget two to three hours for the first build on a clean VM. After that? Adding a host is a five-minute job. Ten if you're being careful.
Why Nagios + Hyper-V in 2026
The monitoring market is loud and crowded, so why do I still reach for the old thing? The plugins, mostly. There are over 5,000 community checks in monitoring-plugins, and I've never yet hit a workload one of them couldn't watch. Then there's the data model, which is blunt in the best possible way. Hosts are UP / DOWN / UNREACHABLE. Services land in OK / WARNING / CRITICAL / UNKNOWN. That's the whole vocabulary. I can hold the entire state of my fleet in my head, and that's worth a small fortune at 3 a.m. when I'm half-awake and something's on fire. The config helps too: plain text, kept in git. No proprietary database humming away where I can't see it. Nothing that ambushes me on upgrade day.
Running Nagios on Hyper-V quietly fixes the parts of self-hosting that usually bite. I snap a checkpoint before I touch the config, so the day I fat-finger a file, and that day comes, I haven't accidentally blinded my own watcher. The VHDX rides inside the Windows backup I already run. No separate dance to remember. And there's isolation, which matters more than people think. The last thing you want is your monitoring dying in the exact same outage as the stuff it's supposed to be screaming about. Hyper-V is free with any Windows Pro or Server license already sitting on your network. So the whole thing costs you nothing.

Step 1: Create the Nagios VM in Hyper-V
Open Hyper-V Manager (Windows + R, type virtmgmt.msc). Right-click your server in the left pane, then New > Virtual Machine. Nothing fancy yet.
Here's the shape I give a fresh Nagios VM that'll watch maybe 50 hosts. Trim it for a lab if you want. This is just the baseline I'm comfortable with:
- Generation 2 (UEFI, Secure Boot). Modern Ubuntu won't boot Gen 1 cleanly, so don't skimp here.
- 2 vCPU and 4 GB RAM (dynamic, min 2 GB / max 6 GB).
- 30 GB VHDX dynamic disk on a fast volume. Nagios barely touches the disk. But logs pile up over months, so give it room anyway.
- External virtual switch bound to your management LAN. The VM has to actually reach the hosts it's probing, obviously.
- If your DHCP hands out leases by MAC reservation, pin the VM's MAC to static. Otherwise you'll be chasing a moving IP later.
One bit everybody misses. In the VM settings, under Security, set the secure boot template to Microsoft UEFI Certificate Authority, not the default Windows one. That's the cert matching Ubuntu's signed bootloader. Leave it wrong and the VM just won't boot, and you'll have no clue why, and you'll lose an hour to it. While you're in there, flip on everything under Integration Services. "Time synchronization" especially. You want this VM's clock glued to the host's, because clock drift on a monitoring box throws the weirdest false alarms. That one took me ages to track down the first time.
Step 2: Install Ubuntu 24.04 LTS and harden it
Grab the Ubuntu 24.04 LTS server ISO from ubuntu.com and mount it on the VM. Boot it, walk the installer. My choices, every single time: minimal install, skip LVM (you don't need it here, it just adds a layer to think about), tick OpenSSH. Then say no to every other snap it tries to push on you. Once it's up, log in and run my usual first-five-minutes hardening pass:
sudo apt update
sudo apt upgrade -y
sudo apt install -y ufw fail2ban unattended-upgrades

# Open SSH and (later) Nagios web UI
sudo ufw allow OpenSSH
sudo ufw allow 80/tcp
sudo ufw allow 443/tcp
sudo ufw enable

# Set hostname for clarity
sudo hostnamectl set-hostname nagios-01
Want the full treatment? SSH key-only, AppArmor in enforce mode, auditd, the whole lot. I keep all of it in our Ubuntu 24.04 hardening checklist, and you really should go do it. Think about what this box actually holds. SSH keys and credentials for half your fleet. An attacker who gets the monitoring server gets a map of everything you've got. Lock it down before it ever sees production.
Static IP recommended. Edit /etc/netplan/00-installer-config.yaml to set a static IP. I learned this the slow, stupid way. Let DHCP move your monitoring server's address and you'll burn a whole afternoon staring at "why are all the probes suddenly failing?" before the penny finally drops.
Step 3: Install Nagios Core 4.5
Quick heads-up. The Nagios in Ubuntu 24.04's apt is 4.4, and the 4.5.x line fixed a fair few things worth having. So I skip the package and build straight from the official tarball. Sounds scarier than it is. Copy the block below, wait a couple of minutes, done.
# Build dependencies
sudo apt install -y autoconf gcc libc6 make wget unzip apache2 apache2-utils \
  php libapache2-mod-php libgd-dev libssl-dev libmcrypt-dev bc gawk dc build-essential

# Create the nagios user/group
sudo useradd nagios
sudo groupadd nagcmd
sudo usermod -aG nagcmd nagios
sudo usermod -aG nagcmd www-data

# Download and extract Nagios Core 4.5.x
cd /tmp
wget https://github.com/NagiosEnterprises/nagioscore/releases/download/nagios-4.5.9/nagios-4.5.9.tar.gz
tar xzf nagios-4.5.9.tar.gz
cd nagios-4.5.9
./configure --with-command-group=nagcmd
sudo make all
sudo make install
sudo make install-init
sudo make install-config
sudo make install-commandmode
sudo make install-webconf

# Install the standard plugins
cd /tmp
wget https://nagios-plugins.org/download/nagios-plugins-2.4.12.tar.gz
tar xzf nagios-plugins-2.4.12.tar.gz
cd nagios-plugins-2.4.12
./configure --with-nagios-user=nagios --with-nagios-group=nagios
sudo make
sudo make install
Now set the web UI password and bring the service up.
sudo htpasswd -c /usr/local/nagios/etc/htpasswd.users nagiosadmin
# Enter a strong password when prompted

sudo systemctl enable nagios apache2
sudo systemctl start nagios apache2
sudo a2enmod cgi rewrite
sudo systemctl reload apache2
Point your browser at http://nagios-01.local/nagios (or just the IP, if mDNS is being difficult). The Nagios login page loads. Sign in as nagiosadmin with the password you just set. Your monitoring server is running.
Nagios Core Version 4.5.9
Current Status > Hosts: 1 UP (localhost)
 Services: 8 OK
Step 4: Configure your first host and probes
Nagios reads its config out of /usr/local/nagios/etc/objects/. One habit has saved me more grief than anything else here. One file per monitored target. Don't cram it all into a single giant .cfg. When something breaks at 2 a.m. you want to open exactly the host that's misbehaving, not scroll through a 600-line wall hunting for it.
sudo mkdir -p /usr/local/nagios/etc/servers
sudo nano /usr/local/nagios/etc/nagios.cfg
# Add this line:
cfg_dir=/usr/local/nagios/etc/servers
Here's an actual host file I'd drop at /usr/local/nagios/etc/servers/web01.cfg. A web server, with the four checks I almost always want watching from day one:
define host {
    use             linux-server
    host_name       web01
    alias           Production web server
    address         10.0.0.10
    max_check_attempts 5
    check_period    24x7
    contact_groups  admins
}

define service {
    use                 generic-service
    host_name           web01
    service_description HTTPS
    check_command       check_http!--ssl -H peoplearegeek.com
}

define service {
    use                 generic-service
    host_name           web01
    service_description SSH
    check_command       check_ssh
}

define service {
    use                 generic-service
    host_name           web01
    service_description Disk root partition
    check_command       check_disk!20%!10%!/
}

define service {
    use                 generic-service
    host_name           web01
    service_description MySQL port
    check_command       check_tcp!3306
}
Those four watch a host from the outside. Useful, but limited. When you want to see inside the thing, CPU and memory, disk per partition, whether some specific process is still breathing, you need NRPE running on the target so Nagios can ask it directly:
# On the monitored host
sudo apt install -y nagios-nrpe-server monitoring-plugins
# Add nagios-01 IP to allowed_hosts in /etc/nagios/nrpe.cfg
sudo systemctl restart nagios-nrpe-server
Always validate before you reload. This -v check has caught me more typos than I'd ever admit out loud, and it's the difference between a clean reload and a monitoring server that flat-out refuses to start:
sudo /usr/local/nagios/bin/nagios -v /usr/local/nagios/etc/nagios.cfg
# Should print "Things look okay - No serious problems were detected"

sudo systemctl reload nagios
Step 5: Mail alerts (SMTP via msmtp)
When Nagios wants to alert you, it shells out to /usr/bin/mail. You could stand up a full Postfix for that. Honestly, don't. On a monitoring box it's overkill and just one more daemon you'll have to patch. I use msmtp, a drop-in sendmail replacement that relays through whatever SMTP server you already have lying around (your host's, SendGrid, SES, doesn't matter). Small and boring. Does the one job.
sudo apt install -y msmtp msmtp-mta mailutils

# Edit /etc/msmtprc
sudo nano /etc/msmtprc
defaults
auth on
tls on
tls_starttls on
logfile /var/log/msmtp.log
account default
host smtp.your-provider.com
port 587
from nagios@yourdomain.com
user nagios@yourdomain.com
password your-smtp-app-passwordThat file holds your SMTP password in plain text. So lock the permissions to 600 before you do anything else, then fire a test:
sudo chmod 600 /etc/msmtprc
echo "Test from nagios" | mail -s "Nagios test" you@yourdomain.com
# You should receive the email in less than a minute
Nagios already ships the notify-host-by-email and notify-service-by-email commands in /usr/local/nagios/etc/objects/commands.cfg, so you don't have to write a thing. What's left is small. Put your real address into /usr/local/nagios/etc/objects/contacts.cfg (the default points at nagios@localhost, which goes precisely nowhere), reload, then prove it works by briefly stopping a probed service. Don't trust the config until you've watched that email actually land in your inbox. Seen it, in front of you.
Step 6: Telegram alerts via bot webhook
Email is the paper trail. Telegram is the tap on the shoulder that says "stop scrolling, look at this now." Mail gets buried under forty other things, while a phone buzz cuts straight through. I think this is the bit most people skip and then regret, and it's maybe five minutes of work.
Message @BotFather on Telegram, create a bot, keep the token it hands you. Then, and this is the part everyone fumbles, send /start to your shiny new bot from your own account. Miss that and the bot literally can't message you back. Trips up basically everyone the first time round. Open https://api.telegram.org/bot<TOKEN>/getUpdates in a browser and your chat_id is sitting right there in the JSON.
Drop this notification script at /usr/local/nagios/libexec/notify-telegram.sh and paste your token and chat ID into the top:
#!/bin/bash
TOKEN="123456:ABC-DEF..."
CHAT_ID="987654321"

MESSAGE="*[$1]* $2: $3
Host: \`$4\`
Service: \`$5\`
State: $6 ($7)
$8"

curl -s -X POST "https://api.telegram.org/bot${TOKEN}/sendMessage" \
    -d "chat_id=${CHAT_ID}" \
    -d "parse_mode=Markdown" \
    -d "text=${MESSAGE}"
sudo chmod +x /usr/local/nagios/libexec/notify-telegram.sh
sudo chown nagios:nagios /usr/local/nagios/libexec/notify-telegram.shNow tell Nagios the command exists, then bolt it onto your admin contact right next to email so alerts hit both channels at once:
# /usr/local/nagios/etc/objects/commands.cfg - append:
define command {
    command_name notify-by-telegram
    command_line /usr/local/nagios/libexec/notify-telegram.sh \
      "$NOTIFICATIONTYPE$" "$HOSTSTATE$" "$SERVICESTATE$" \
      "$HOSTNAME$" "$SERVICEDESC$" "$SERVICESTATE$" \
      "$SERVICESTATEID$" "$SERVICEOUTPUT$"
}

# /usr/local/nagios/etc/objects/contacts.cfg - add to the contact block:
service_notification_commands notify-service-by-email,notify-by-telegram
host_notification_commands    notify-host-by-email,notify-by-telegram
Reload, then force a real test by knocking over a probed service. My phone buzzes a second or two later, and that's when I stop fiddling with it.
Step 7: Custom dashboard and views
Let's be honest about the stock Nagios UI. It works. It also looks like it was last styled in 2009, because it was. You don't have to live with it, though. Two community projects bolt a modern face on without ever touching the core engine:
- Thruk (thruk.org) is the one I keep reaching for. It's a Perl frontend that reads the same Nagios config you already wrote, then hands you proper filtering and business-hour reporting and a UI that doesn't fall apart the second you open it on a phone. Install is one line:
sudo apt install thruk. - NagVis overlays host status onto an actual picture. A network diagram, say, or the floor plan of your building. It's what I pull up when a manager wants green and red lights instead of a grid of hostnames they're never going to read.
And you don't have to pick one. Both happily run alongside the old CGI UI. So try them, keep whichever one your team stops complaining about.
Step 8: Snapshot and routine maintenance
While the install is still clean and boring, take a Hyper-V checkpoint (right-click the VM > Checkpoint). That's your undo button. The day a config edit goes sideways, and it will, you roll back to this and you're whole again in seconds instead of rebuilding the box from nothing. Get in the habit of snapping one before every real change. Future-you says thanks.
And monitoring isn't set-and-forget, much as we'd all love it to be. The rhythm I keep, more or less:
- Weekly: skim
/var/log/nagios.logfor the same warning showing up over and over. That repetition is almost always a service flapping. It means your flapping thresholds need a nudge, not that the host is genuinely dying. - Monthly:
sudo apt upgradethe VM. Checkpoint first, restart Nagios after. In that order, because the one time you skip the checkpoint is the time the upgrade eats something. - Quarterly: reconcile the host list against reality. Every box you monitor should still exist. Every box that exists should be monitored. That second half is the quiet killer, because the server nobody bothered to add is the one that goes down at 3 a.m. with zero alerts firing.
- Yearly: revisit your WARNING / CRITICAL levels. After twelve months you've finally got real numbers for how this fleet behaves, and tuned thresholds beat the out-of-the-box guesses every time.
Common pitfalls and how to avoid them
- Alert fatigue. The moment your team starts swiping Nagios emails away unread, you've already lost. And it's a threshold problem more than a people problem. The alerts are crying wolf. Push the WARNING level up until a notification reliably means "a human needs to look at this," not "Nagios is being chatty again."
- Probed host firewalls. This one's caught me more than once. A host is perfectly fine but shows DOWN, and it's because its own firewall is quietly dropping the probe. Run
sudo ufw allow from 10.0.0.5on the target (swap in your real Nagios IP) and watch it flip green. - Time drift between hosts. When Nagios and a probed host disagree on what time it is, two nasty things happen. Your logs stop lining up. And SSL probes start failing at random, with no obvious cause, which will drive you up a wall. Check NTP everywhere with
timedatectl status. Thirty-second check, saves you hours. - Forgetting to monitor Nagios itself. This is the gotcha that bites hardest. If the monitoring server crashes, it goes quiet, and silence reads exactly like "everything's fine." So put a tiny check on a second box (a cheap VPS, even your laptop) that just confirms the Nagios web UI still answers. Who watches the watcher? Has to be you. It can't watch itself.
Sources and further reading
Frequently asked questions
Why Nagios in 2026 instead of Zabbix or Prometheus?
Honestly? Depends on what you're protecting and who's holding the pager. I reach for Nagios when I want something simple and battle-tested that an on-call engineer can poke at half-asleep without opening a single doc. Zabbix earns its keep when you want time-series graphs and a database-backed config UI baked right in. Prometheus and Grafana are the move if you're running a microservices stack that already coughs up metric endpoints and you care about long-term trends. None of them is wrong. They just fit different shops. The one genuinely bad call is running nothing, then hearing about your outages from customers.
Can I run Nagios in WSL2 instead of a Hyper-V VM?
You can. For production, I'd tell you not to. The deal-breaker: WSL2 tears itself down the moment you sign out of the Windows session. So the second nobody's logged in, your monitoring is dead and you won't even know. A real Hyper-V VM keeps running whether anyone's at the console or not, which is sort of the whole point of a monitoring box. WSL2 is great for learning these steps, or messing about in a lab. Just don't hand it your fleet.
How many hosts can a single Nagios VM monitor?
More than you'd think from such a small box. The 2 vCPU / 4 GB build in this guide cruises through 100-200 hosts and somewhere around 1,000-2,000 services without breaking a sweat. When you start brushing the top of that, you've got two moves. Tune the back end with NDOUtils. Or scale out, running several Nagios instances federated behind a single Thruk frontend. Maybe I'm lucky, but I've never had a small or mid-size shop outgrow one well-fed VM.
Can I monitor Windows hosts from Nagios?
Absolutely. Do it all the time. Put NSClient++ on each Windows box (free, just an MSI), let port 5666 through from the Nagios server, then drive it with check_nt or check_nrpe. From there you watch the usual suspects. CPU load, memory, free disk, whether a service is actually running, event log entries, even whether a scheduled task really fired or just claimed to. Plenty to keep a Windows fleet honest.
Should I use Nagios XI (the paid version)?
Depends who's signing off on the invoice. XI bolts a config UI, dashboards, reporting and a real support contract onto Core. If your team would rather click than edit text files, or you flat-out need a vendor to phone when things break, the licence pays for itself fast. But if you're happy keeping config in git, like the setup in this guide, Core plus Thruk gets you basically everything XI offers for nothing. I run Core. Never once felt like I was missing out.