Core Web Vitals in 2026 come down to three letters that decide whether Google thinks your pages feel fast: LCP (Largest Contentful Paint), INP (Interaction to Next Paint), CLS (Cumulative Layout Shift). They move where you rank on the queries everyone is clawing for, and they decide whether a visitor sticks around long enough to convert instead of bouncing in disgust. So this is the stuff I have actually shipped, not theory. Every metric gets a before/after snippet I ran in production, I will show you how I read a Lighthouse capture without lying to myself about it, plus the WordPress and Cloudflare toggles that bought me the biggest wins, the ones I reach for first.
The short answer
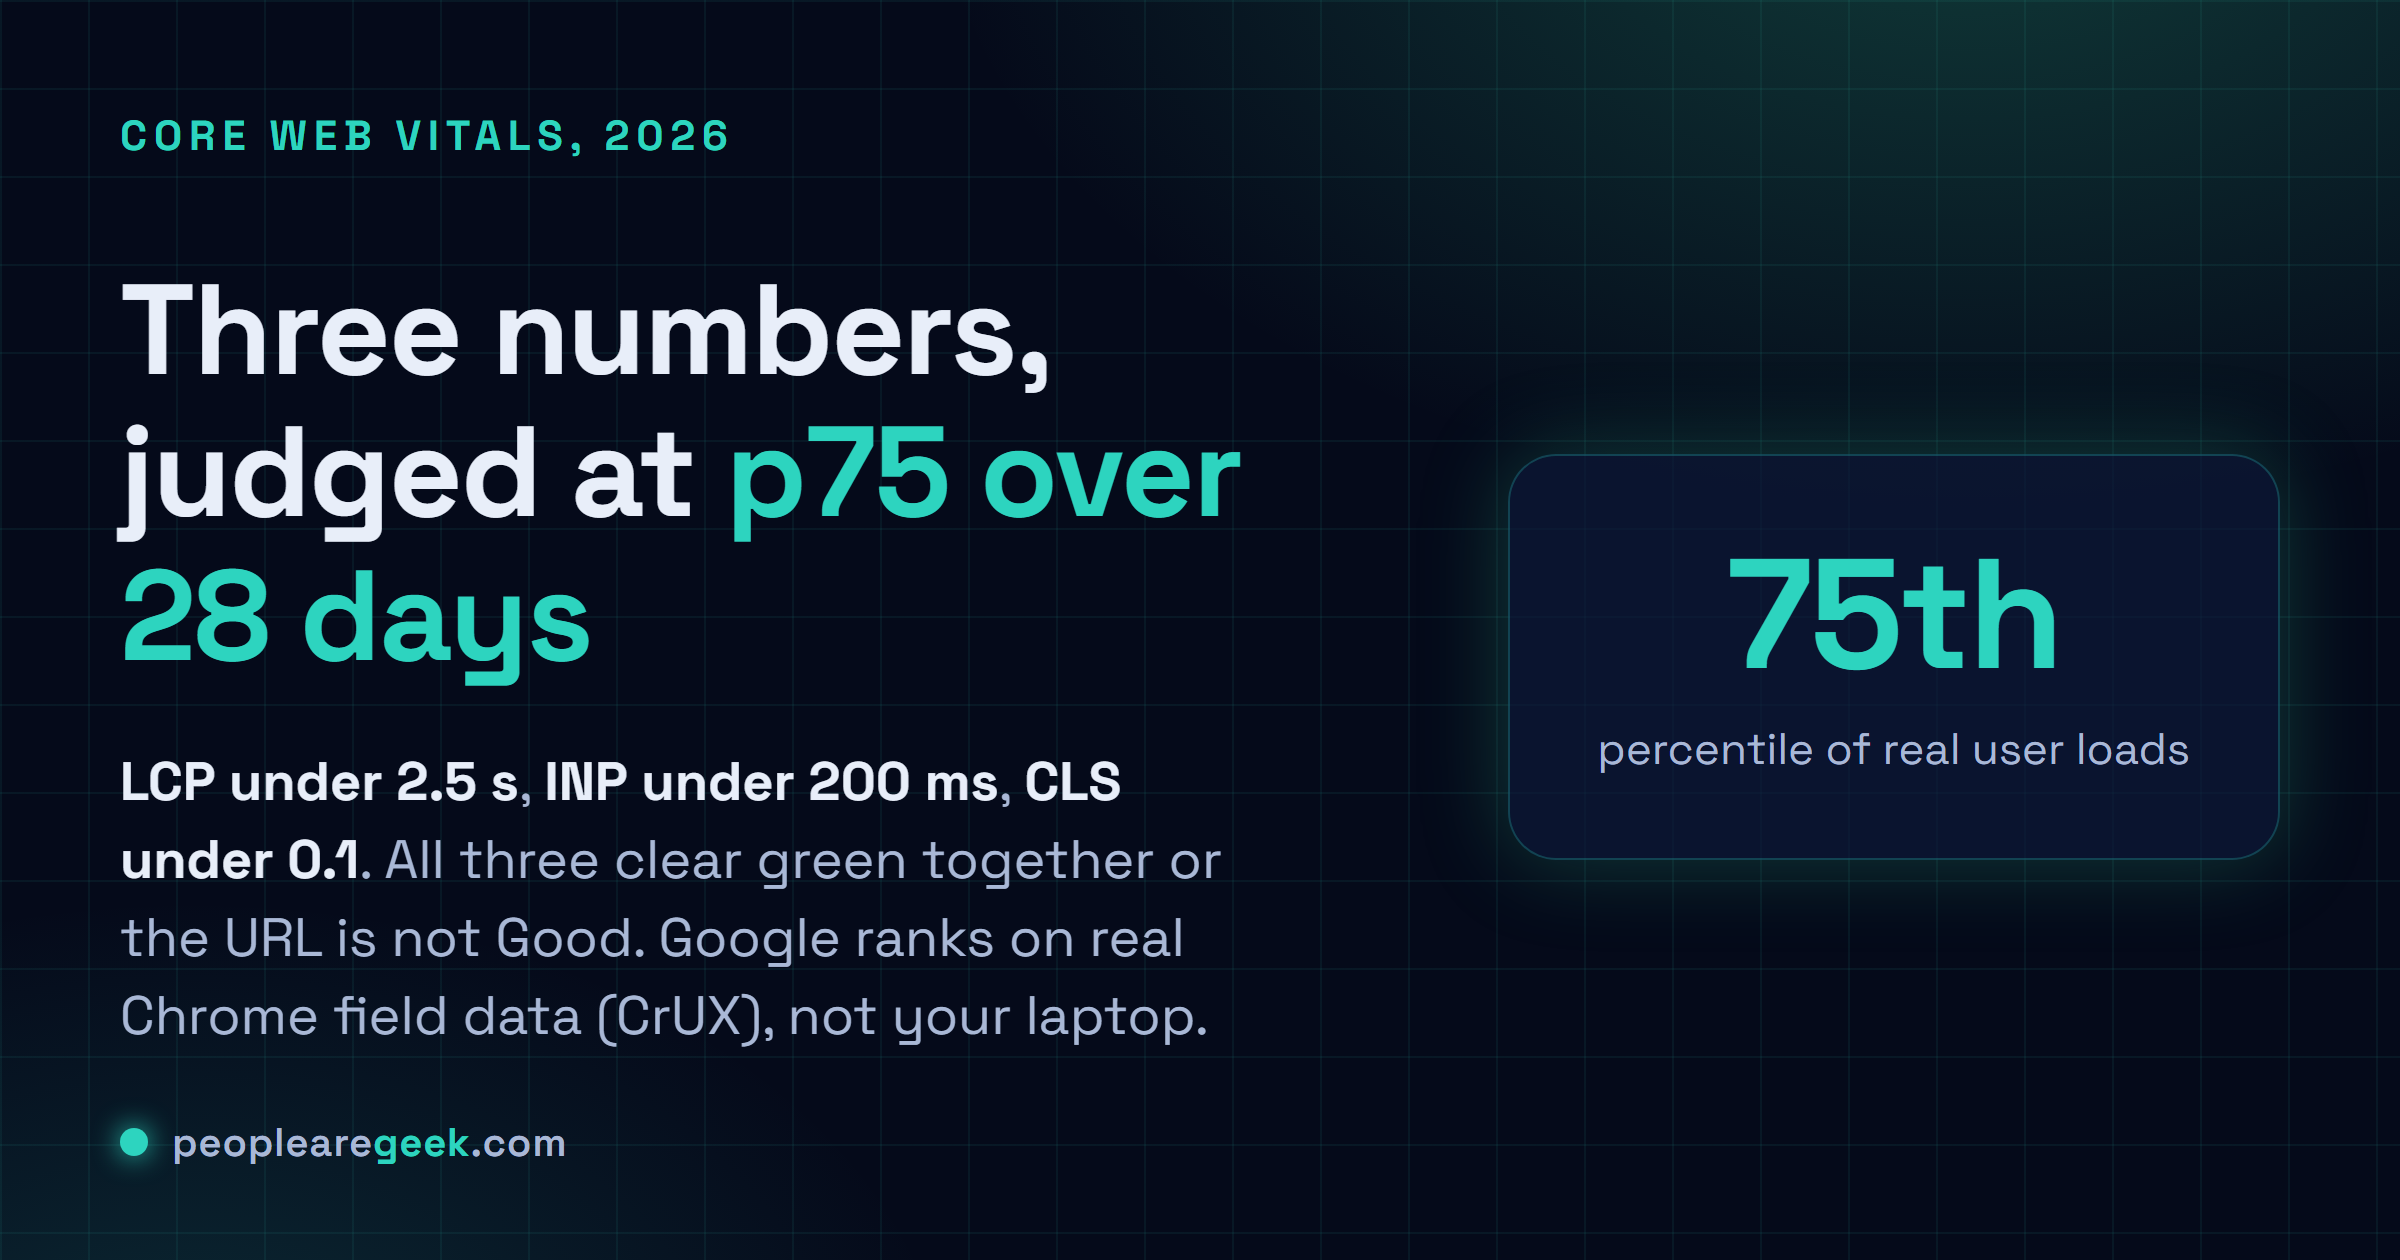
Core Web Vitals reward field data, not your laptop. All three (LCP, INP,
CLS) have to clear green together, at the 75th percentile, over 28 rolling
days of real Chrome users (CrUX). The fastest wins come from a page cache, an
AVIF hero with fetchpriority="high" and no loading="lazy", debounced work
moved into a Web Worker, and width/height on every image. Lighthouse is for
iterating; Search Console "Page Experience" is what actually ranks you.

Three letters. They decide whether Google thinks my pages feel fast, and I've lost more sleep to them than I'd ever admit out loud: LCP (Largest Contentful Paint), INP (Interaction to Next Paint), CLS (Cumulative Layout Shift). Together they're the Core Web Vitals. In 2026 they move where you rank on the queries everyone's clawing for, and they decide whether a visitor sticks around long enough to convert instead of bouncing in disgust. So this is the stuff I've actually shipped, not theory. Every metric gets a before/after snippet I ran in production, I'll show you how I read a Lighthouse capture without lying to myself about it, plus the WordPress and Cloudflare toggles that bought me the biggest wins, the ones I reach for first.
The 2026 "Good" thresholds and where Google measures them
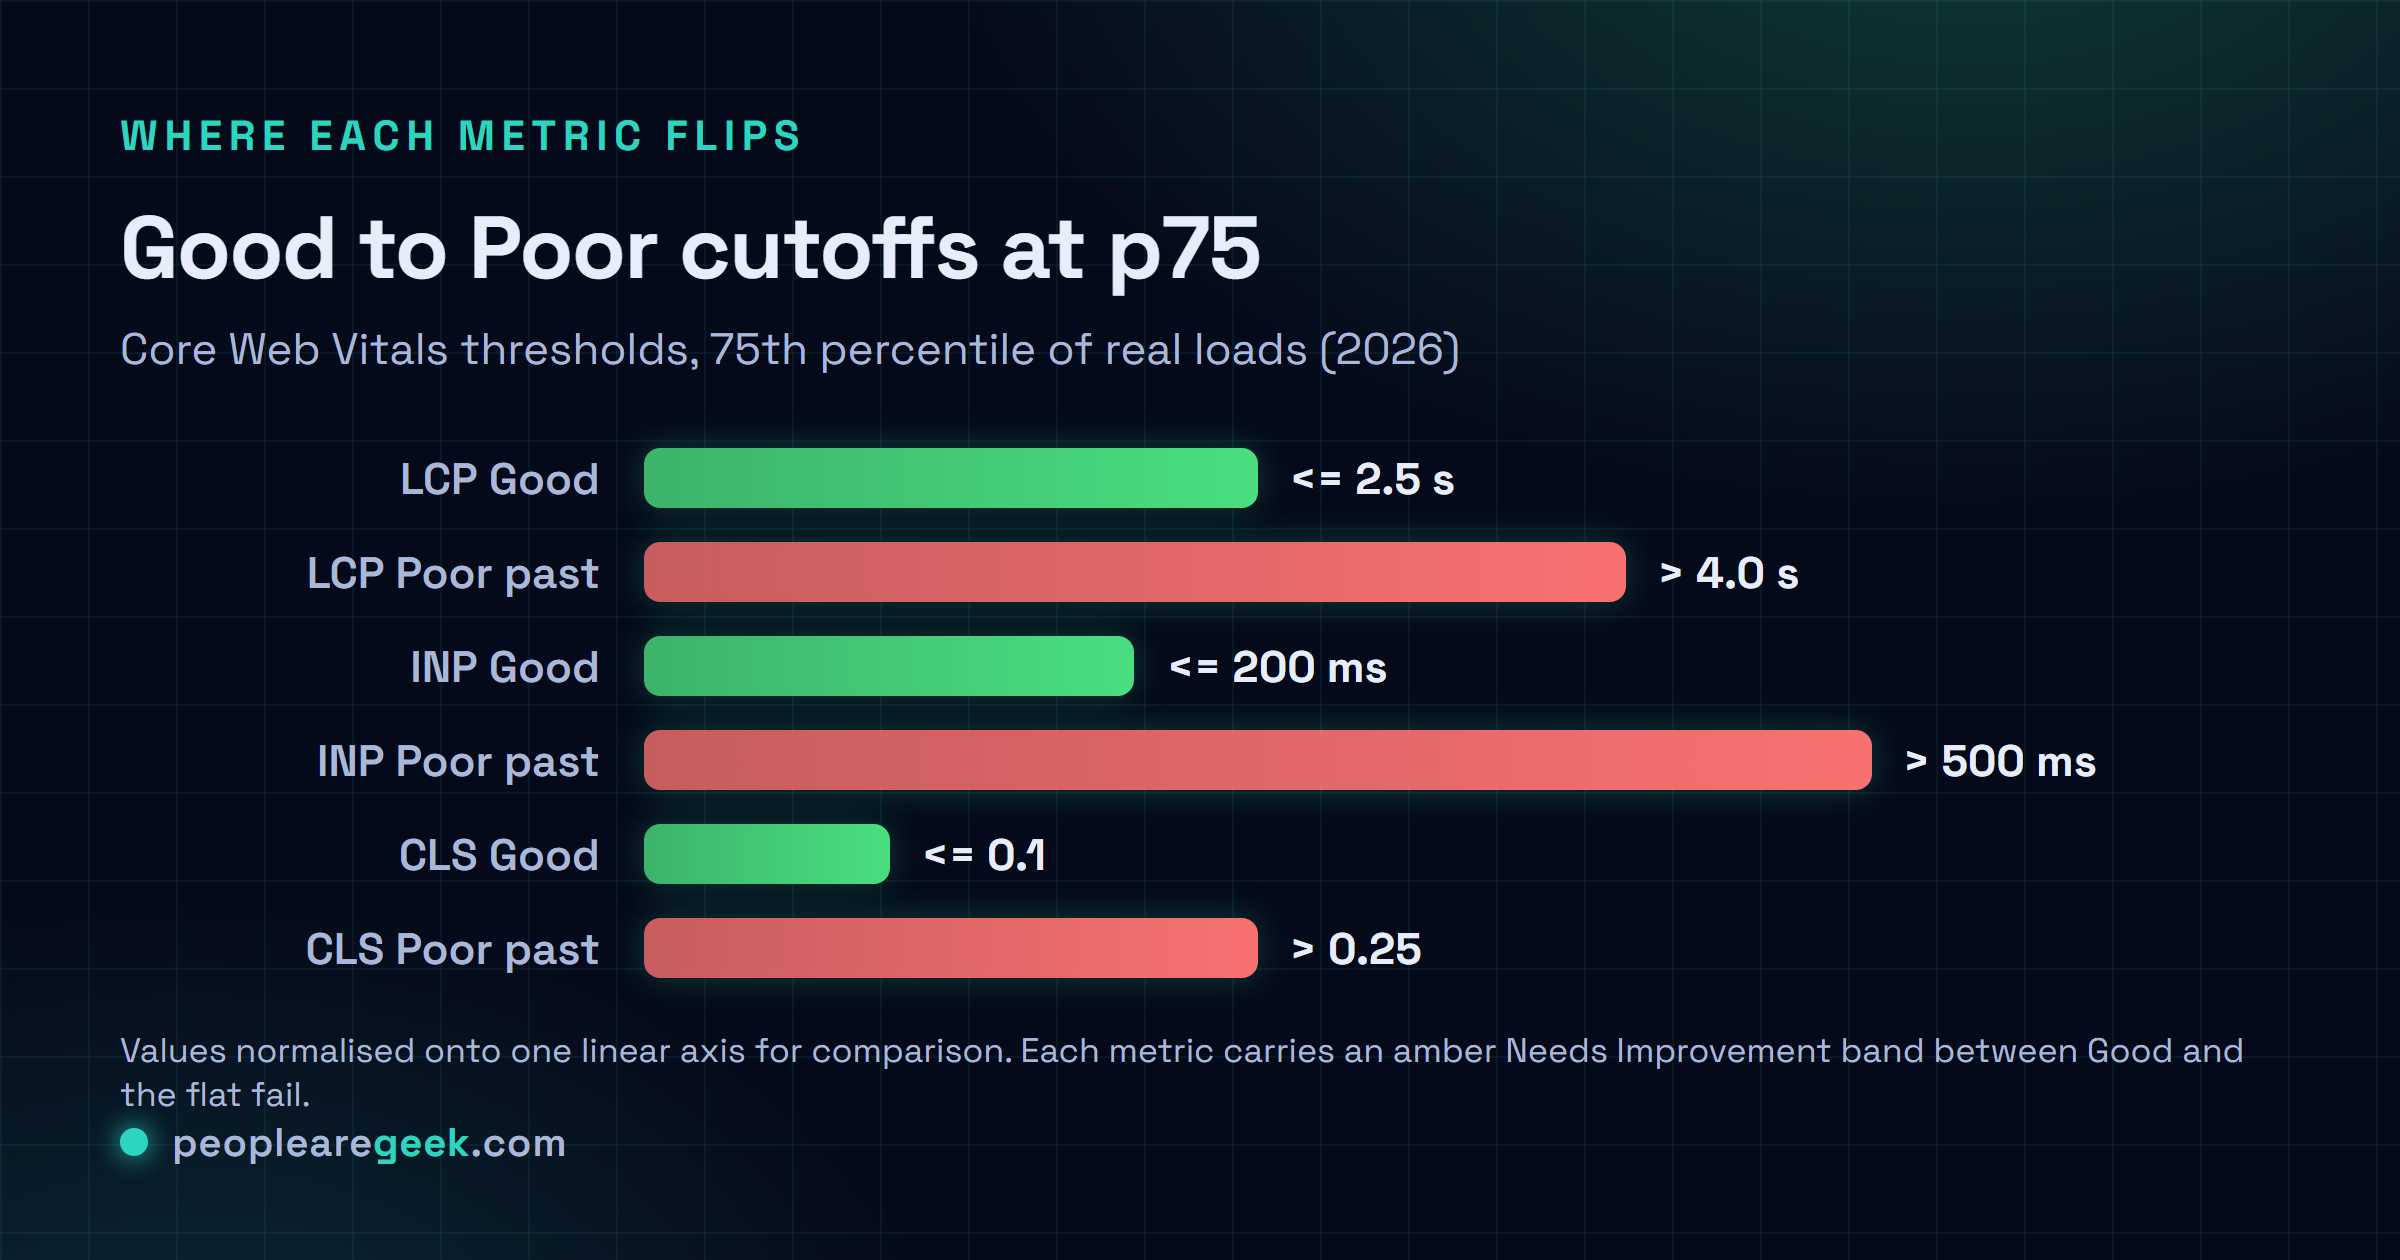
Here's where people trip. You don't earn the "Good" badge by acing one metric. All three have to pass together, at the 75th percentile, over 28 rolling days of real field data (CrUX). The numbers haven't budged since 2024: LCP under 2.5 s, INP under 200 ms, CLS under 0.1. Miss them and you drop into "Needs Improvement" up to LCP 4 s, INP 500 ms, CLS 0.25. Past that? Red.
And this one cost me a full week early on. Google ranks you on field data from opt-in Chrome users, not on whatever Lighthouse whispers to you locally. Lighthouse is genuinely useful while you iterate. But a glowing Lighthouse 95 sitting next to a 4-second p75 in CrUX is the trap that gets absolutely everyone, me included. You're timing your 1 Gbps fibre on an M3 MacBook. Your visitor is on a knackered Android over 4G in a train tunnel. Believe the Search Console "Page Experience" report and your own client-side web-vitals numbers. Nothing else gets a vote.

LCP: before/after code and optimisations
LCP is a clock. It stops the moment your biggest above-the-fold thing finishes painting, usually the hero image, occasionally a title block or a video frame. Only a few levers are worth pulling here, and server TTFB is the big one. After that, whatever's blocking render in the <head>, and how long the LCP element itself takes to show up. Get those right and the rest barely registers.
Case 1: Hero image lazy-loaded by mistake
I've shipped this one by accident. More than once, which is embarrassing. Some hero plugin slaps loading="lazy" on every image it can find, including the exact one that defines your LCP. So the browser shrugs, discovers it way too late, and boom, you're north of 4 s wondering what happened.
Before, LCP 4.2 s
<img src="/uploads/hero.jpg"
     loading="lazy"
     width="1200" height="600"
     alt="Hero image">
After, LCP 1.7 s
<img src="/uploads/hero.avif"
     fetchpriority="high"
     width="1200" height="600"
     alt="Hero image">
<!-- no loading="lazy" on the LCP image -->
Pair fetchpriority="high" with an AVIF source (keep a WebP fallback, some old browsers still need it) and you'll usually claw back 1.5 to 2 s on the hero alone. Don't get greedy, though. Strip loading="lazy" off this single image, this one, and leave it on everything below the fold. Lazy-loading the rest is still exactly right.
Case 2: Web font blocking render
You grab a font from Google Fonts with a plain <link rel="stylesheet">, call it done, move on. Except that link is render-blocking. The browser sits there twiddling its thumbs, waiting on the font file before it'll paint one single word of your title. Your text LCP eats the whole delay.
Before, LCP 3.4 s
<link href="https://fonts.googleapis.com/
  css2?family=Inter:wght@400;700"
  rel="stylesheet">
After, LCP 1.9 s
<link rel="preconnect"
  href="https://fonts.gstatic.com" crossorigin>
<link rel="preload"
  href="/fonts/inter-700.woff2"
  as="font" type="font/woff2" crossorigin>
<style>
  @font-face{font-family:Inter;
    font-display:swap;
    src:url(/fonts/inter-700.woff2)
        format('woff2');}
</style>
A few small moves do the heavy lifting. Self-host the file, which kills an entire round-trip to fonts.googleapis.com. Add font-display: swap so the text shows in a fallback while the real font catches up. Then preload only the weight that actually appears above the fold, not the whole family. That combo has saved me 1 to 1.5 s of text LCP, pretty reliably.
INP: before/after code and optimisations
INP punishes your worst moment, not your average. It records the slowest interaction across the entire life of the page, so a single click that hangs for 800 ms yanks you into amber even when every other tap snaps back in 50 ms. You can't bury one bad interaction under a thousand good ones. It doesn't work that way, and honestly it took me a while to make peace with that.
Case 3: Synchronous long task blocking the UI
Here's a classic I keep tripping over in the wild. A client-side filter that loops across 8,000 items and re-renders on every keystroke. That's 600 ms of frozen main thread per character typed, and the user feels every miserable millisecond of it.
Before, INP 620 ms
input.addEventListener('input', (e) => {
  const q = e.target.value.toLowerCase();
  const filtered = items.filter(item =>
    item.name.toLowerCase().includes(q)
  );
  render(filtered); // blocks 620ms
});
After, INP 95 ms
let timer;
input.addEventListener('input', (e) => {
  clearTimeout(timer);
  const q = e.target.value.toLowerCase();
  timer = setTimeout(async () => {
    const filtered = await runInWorker(items, q);
    render(filtered);
  }, 80); // debounce + Worker
});
Two moves carry the fix. Debounce, so you stop recomputing on every keystroke. Then shove the heavy loop into a Web Worker, which keeps the main thread free to respond to the user. And if a full Worker is more rework than you can stomach right now (I get it, sometimes the deadline wins), sprinkle scheduler.yield() between chunks so the browser gets a chance to breathe. I go deeper on the Worker side in our Web Workers guide.
Case 4: Non-passive scroll listeners
This one's sneaky. A scroll listener that isn't marked passive forces the browser to wait and check whether you're going to call preventDefault. On every pixel of scroll. That jams the compositor cold, and on a phone the first tap right after a scroll suddenly balloons out of nowhere. Took me ages to figure out why.
Before, INP 380 ms
window.addEventListener('scroll', () => {
  updateProgressBar();
});
After, INP 110 ms
window.addEventListener('scroll', () => {
  requestAnimationFrame(updateProgressBar);
}, { passive: true });
CLS: before/after code and optimisations
CLS measures the thing you hate as a user. You go to tap a button, and the whole page lurches. It tallies every unexpected shift while the page settles down: a banner that pops in late, or the font swap that quietly reflows a paragraph under your thumb. An image with no reserved space does the same thing. It all adds up, and none of it is the user's fault, yet they're the ones cursing at the screen.
Case 5: Image without dimensions
Before, CLS 0.28
<img src="/article/figure.jpg"
     alt="Diagram">
<!-- no dimensions, the browser
     cannot reserve space -->
After, CLS 0.02
<img src="/article/figure.jpg"
     width="800" height="450"
     style="aspect-ratio:800/450;
            max-width:100%;height:auto"
     alt="Diagram">
Case 6: Cookie banner pushing content down
The cookie banner turns up 800 ms after LCP, drops in at the top of the body, and shoves everything below it down the page. I've watched one banner push CLS past 0.30 all by itself and take the whole metric down with it.
Before, CLS 0.32
// Inject banner into body at runtime
document.body.prepend(banner);
After, CLS 0.03
/* Banner at fixed position at bottom */
.cookie-banner{
  position:fixed; bottom:0; left:0; right:0;
  z-index:9999;
}
/* OR reserve space in the HTML:
   <div id="cookie-slot"
        style="height:0;overflow:hidden"></div> */
WordPress-specific optimisations
Most of my client sites run WordPress, and it ships with a handful of traps that bite the same way every time. The list below is roughly the order I work through them in. On a typical site it pulls around 30 points onto the mobile Lighthouse score and drags all three vitals into green. Roughly. Your mileage varies with the theme, obviously.
- Page cache plugin: WP Rocket, LiteSpeed Cache or W3 Total Cache. Serve the HTML straight from cache instead of rebuilding it on every request, and TTFB falls off a cliff. 800 ms down to 80 ms, in my experience. Reach for this one first. It's usually worth about 700 ms of LCP all on its own.
- Disable unused global scripts: Contact Form 7, WooCommerce, Elementor. They cheerfully load their JS on pages that never use a line of it.
Asset CleanUporPerfmatterslets you switch them off page by page, and every script you kill is worth 100 to 250 ms of INP. - Native lazy-load except hero: hook
add_filter('wp_get_attachment_image_attributes', ...)to forcefetchpriority="high"onto the first content image, and leave lazy on everything else. It's just the code version of the hero fix from earlier. - Compress and convert images to AVIF: ShortPixel, Imagify or Smush in "AVIF priority" mode. That's where I've watched 1 to 2 s drop off the LCP image, and your bandwidth bill falls 30 to 50 percent while you're at it.
- Preload the critical web font: drop a
<link rel="preload" as="font">in through thewp_headfilter, or hand the job to the Pre* Party Resource Hints plugin if you'd rather not touch PHP at all. - Disable unused emojis and embeds:
remove_action('wp_head', 'print_emoji_detection_script', 7)andremove_action('wp_head', 'wp_oembed_add_discovery_links'). Tiny on their own, sure. But they stack up. Call it 50 to 100 ms you didn't need to leave lying on the table.
Cloudflare-specific optimisations
Already sitting behind Cloudflare, free or Pro? There's a pile of toggles in the Speed panel that pay off the instant you flip them, with no code to write and nothing to deploy.
- Early Hints (free): Cloudflare fires a
103 Early Hintscarrying yourpreloadandpreconnectbefore your origin has even said a word, so the browser starts fetching early. I get 200 to 400 ms of LCP on cold loads out of this. - HTTP/3 and 0-RTT (free): flip them both on under Network. Won't move the needle much on fibre. On a flaky mobile connection, though, it's a steady 100 to 200 ms of LCP.
- Auto Minify and Brotli (free): squeezes your HTML/CSS/JS on the way out, 15 to 25 percent less to download. Free win. Leave it on and forget about it.
- Cache Reserve (Pro): parks your static assets in a long-lived persistent cache so Cloudflare quits phoning your origin to revalidate every time.
- Disable Rocket Loader: ignore the optimistic name. It serialises your JS loading and makes INP worse on anything remotely modern. Turning it off has handed me about 150 ms of INP more times than I can count.
- Image Resizing / Polish (Pro): AVIF/WebP conversion plus per-device resizing right at the edge. On mobile that's another 1 to 1.5 s off the LCP image, and you never touch your media library.
Not even sure Cloudflare is in the path? Our CDN Detector tells you in a couple of seconds whether it's live and which cache actually served the request.
Reading a Lighthouse capture correctly
A Lighthouse panel shows you LCP, INP/TBT and CLS side by side, each with a "Good" badge once it clears. Easy numbers to misread, though, so here's how I read them.
I never trust a capture until I've checked a few things. 1) Lighthouse won't show you INP at all. It shows TBT and quietly hopes you'll treat it as a stand-in. Want the real INP? Instrument with web-vitals, or read it straight off the PageSpeed Insights "Field Data". 2) That score out of 100 is weighted, it's not an average. LCP is 25 percent, TBT 30, CLS 25, FCP 10, Speed Index 10. So you can post a glossy 90-something and still be sunk if a single vital is stuck on amber. 3) Mobile Lighthouse throttles you on purpose, 4x slower CPU and a Slow 4G network. The numbers look brutal by design. That's the whole point, because it's a lot closer to the phone in your visitor's hand than your dev machine will ever be.
Sources and further reading
Frequently asked questions
How long until an optimisation shows up in Search Console?
Slower than you would like. CrUX runs on a 28-day rolling window, so on a busy page you will catch the first wobble in Search Console after roughly 7 days, but the number will not truly settle until day 28. That wait is maddening when all you want to know is whether the fix actually landed. So do not sit there refreshing. Bolt the web-vitals library onto your pages, ship the numbers to your own analytics, and you will have your answer inside 24 hours instead.
My Lighthouse score is 95 but Search Console shows amber. What do I do?
Welcome to the lab-vs-field gap. I see this one constantly, honestly it might be the most common confusion I get asked about. Lighthouse is timing your fast machine. Search Console is reporting your actual visitors, who are mostly on phones and so-so networks. Open the CrUX report in PageSpeed Insights, find the field metric that has gone red, fix that. And whatever you do, do not burn a whole afternoon dragging Lighthouse from 95 to 100. Those last five points buy you nothing a single user will ever feel.
Is a premium cache plugin worth paying for in 2026?
Depends entirely on where you are hosted. On shared hosting like OVH or Hostinger? Yes, easily. WP Rocket (or LiteSpeed Cache, which is free if you happen to be on a LiteSpeed server) is the line between a sluggish site and a snappy one, and it is the cheapest speed I know how to buy. But on a proper managed host, your Kinsta or WP Engine or O2switch, their own server-side cache already does most of the heavy lifting, so a free plugin like Cache Enabler is plenty. No sense paying twice for the same cache.
My images are already compressed, why is my LCP still bad?
Smaller files do not help if the browser reaches the image late, and that is usually exactly what is going on. A few culprits I would check, in order. First, the LCP image is lazy-loaded; look at its loading attribute first, it is the most common offender by a mile. Second, JavaScript injects the img after DOMContentLoaded, so the browser only stumbles onto it once the party is over; render it in the server HTML instead. Third, your origin is just slow, TTFB north of 800 ms, and no image trick on earth fixes a slow server. Turn on a page cache or move hosts.
How do I prioritise if I only have a day to optimise?
Here is the exact order I work in when the clock is against me. First, turn on a page cache, the biggest LCP swing for the least effort. Second, yank loading=lazy off the hero image. Third, put width and height on every image so nothing jumps around. Fourth, preload your main web font. Fifth, switch off the heavy plugins nobody is actually using. Just those five gets you most of the way there, somewhere around 80 percent of the gain, usually before lunch.