A VMware ESXi PSOD just dropped every VM on the host and threw a wall of purple text at the console. That is the Purple Screen of Death, ESXi's take on a Windows blue screen: the VMkernel hit something it could not recover from and froze on purpose, rather than scribbling garbage all over your VM data. It looks like the end of the world. It usually is not. That screen is basically a confession, and once you know which lines to read, it points straight at whoever did it. Here is the order I work a PSOD in. Read the screen, narrow it to one of maybe five usual suspects, pull the coredump while it is still there, bring the host back, then make sure the same thing is not waiting to bite you next week.
The short answer
A PSOD is the VMkernel halting on purpose to protect your VM data. Read five
spots on the screen (build, #PF Exception 14 or LINT1/NMI, the top
backtrace frame, coredump status, dump target), and the exception plus the top
frame name the cause between them. Photograph the screen, pull the coredump,
then power-cycle the host and chase the driver, firmware or heap that did it.
A host just dropped every VM it was running and threw a wall of purple text at the console. Welcome to the Purple Screen of Death (PSOD), which is ESXi's take on a Windows blue screen. The VMkernel hit something it couldn't recover from and froze on purpose. The alternative? Letting it scribble garbage all over your VM data, and that's worse. Looks like the end of the world. It usually isn't. That screen is basically a confession, and once you know which lines to read, it'll point straight at whoever did it. Here's the order I work a PSOD in. Read the screen. Narrow it to one of maybe five usual suspects, pull the coredump while it's still there, bring the host back, then make sure the same thing isn't waiting to bite you next week.
What a PSOD actually is
Under the hood, ESXi is a tiny purpose-built kernel called the VMkernel, sitting right on the metal. When it trips over something it can't safely keep running from (a bad memory access, or a non-maskable interrupt thrown up by the hardware, or some internal sanity check that just doesn't add up), it doesn't try to limp along. It stops dead and paints that purple diagnostic screen. Continuing would mean gambling with your VM data, which is a worse outcome than an outage, so it doesn't. Every VM on the box freezes in that instant. Treat the PSOD as a symptom, never the disease. Most of the time the real culprit is a flaky driver, or hardware on its way out. An actual ESXi bug? That one's rare, and honestly I'd bet against it before I'd bet on it, though I'll admit I've been surprised once or twice.
The five things to read on the screen
First thing, before you lay a finger on the keyboard: photograph the whole screen. Then walk these five spots. That's where the answer's hiding.
- The ESXi build up top. You'll want it later to check the failing driver against the VMware Compatibility Guide for that exact build. "Close enough" doesn't count here, and I learned that the annoying way.
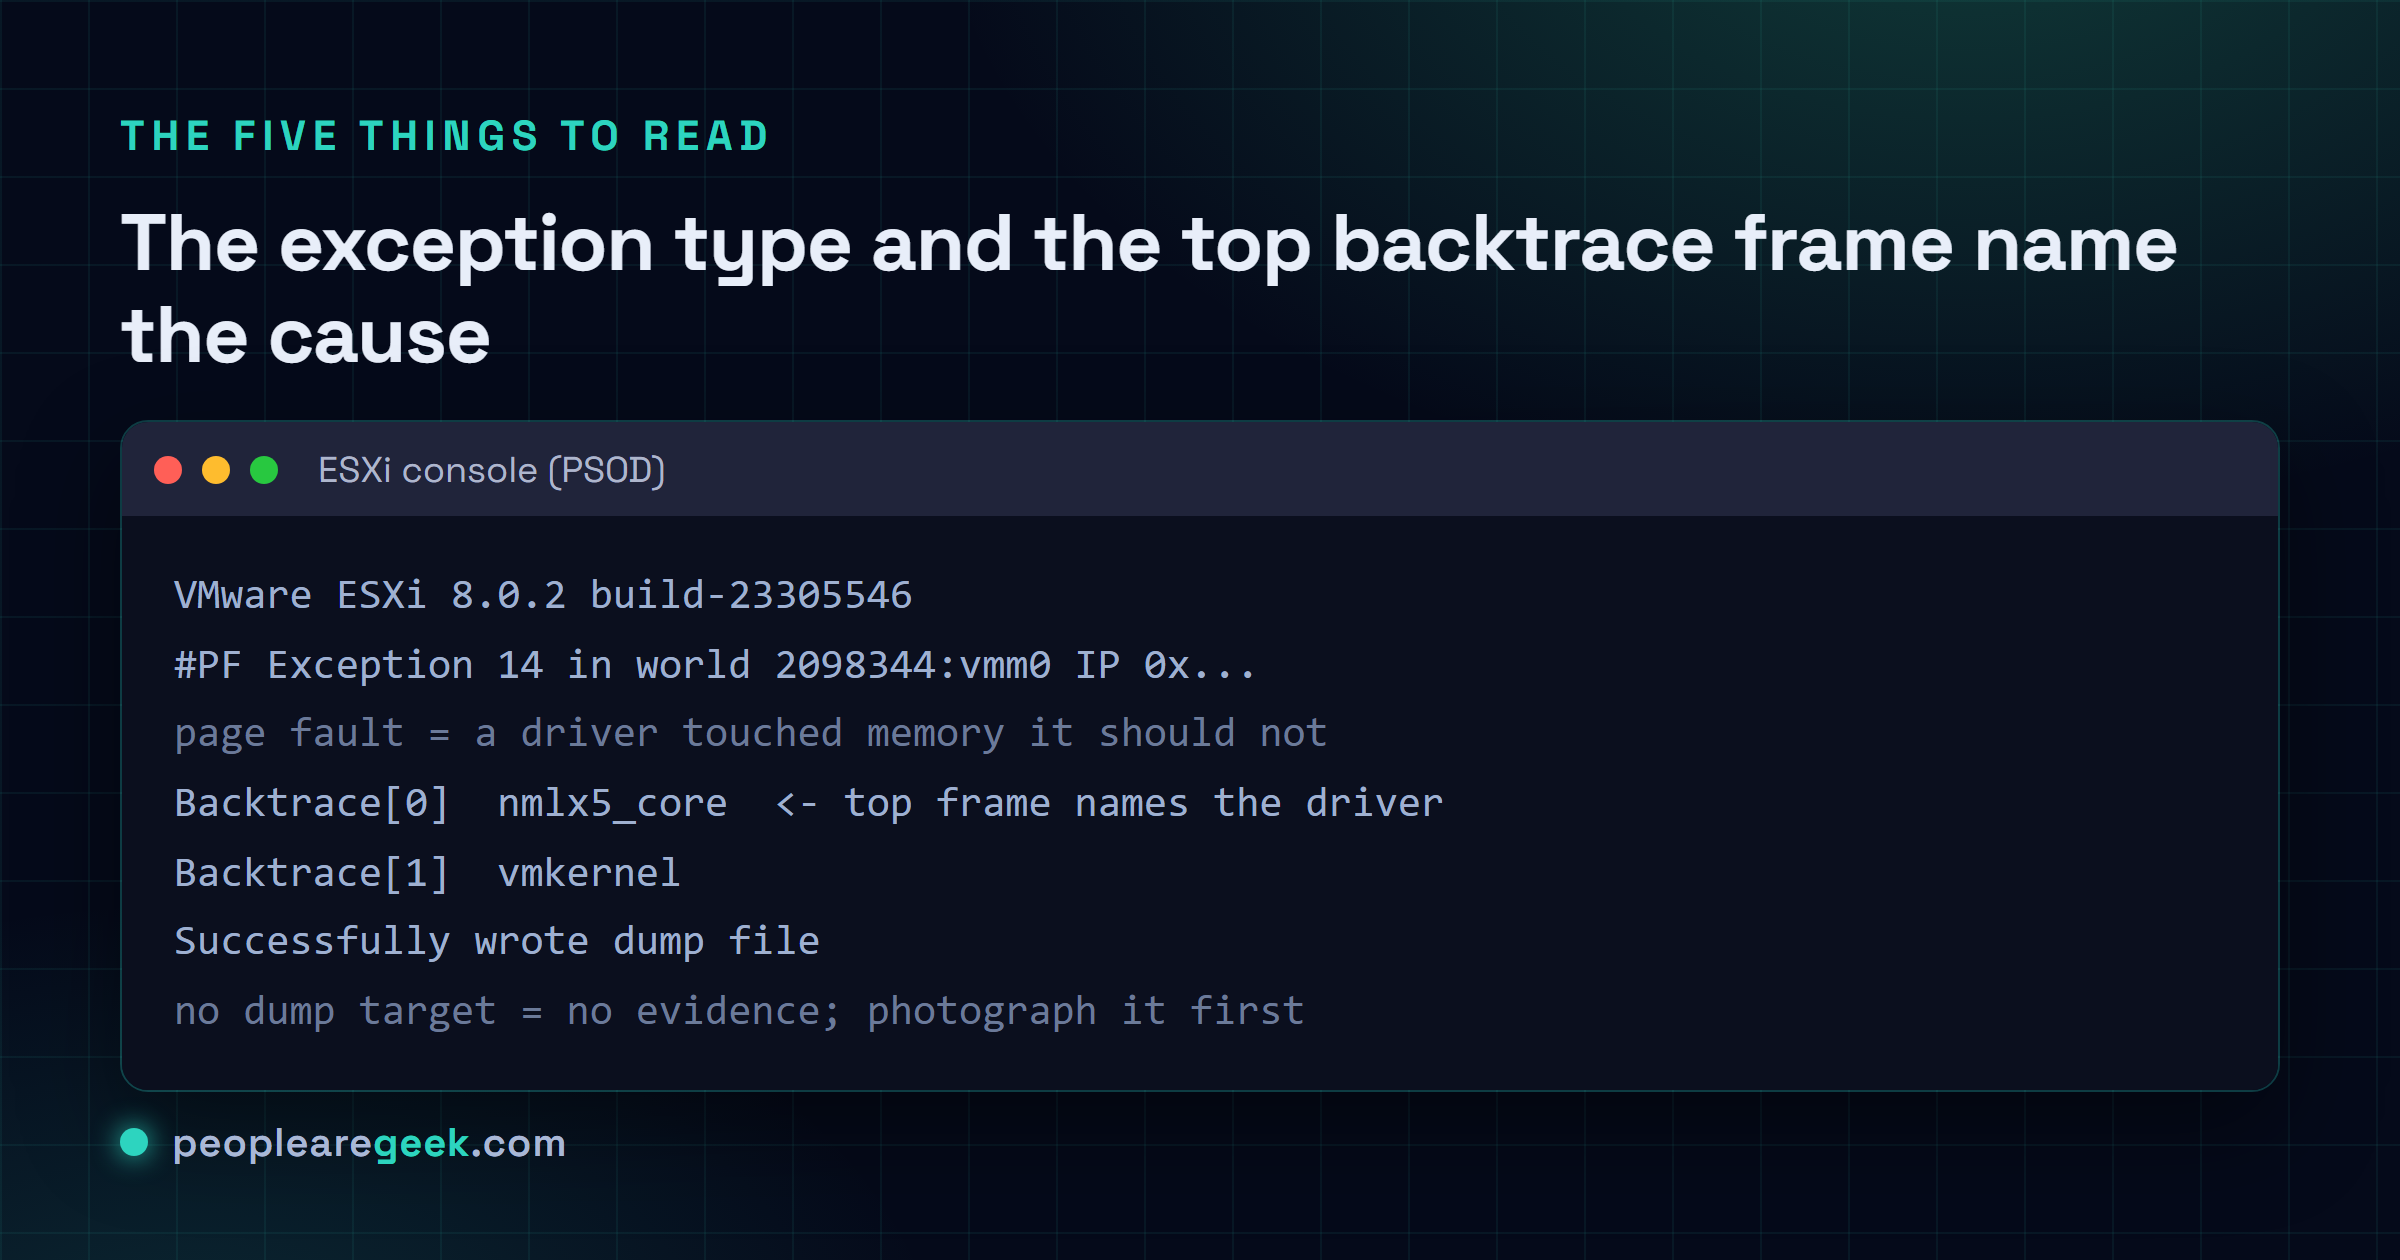
- The exception type. A
#PF Exception 14is a page fault, which means a driver reached into memory it had no business touching. SeeLINT1 motherboard interruptorNMIinstead? That bubbled up from the hardware. A VMFS or heap message is storage waving its hand at you. - The top of the backtrace. Read top-down. The first named module is almost always your guy: a NIC driver, or some storage HBA driver, maybe a multipathing plugin. Everything below it is mostly the kernel falling over. It's that top line I care about.
- The coredump status. "Successfully wrote dump file" is the line you're hoping for, because now you've got something to dig into. "No place on disk to dump data" means nothing was set up to catch it. You just lost your evidence.
- Whether a dump target even exists. If it doesn't, fix that before anything else, so the next PSOD actually leaves you something to work with.

The causes behind almost every PSOD
| Signature on screen | Most likely cause |
|---|---|
#PF Exception 14 + a driver name | Faulty or mismatched driver (NIC, HBA, RAID), update or roll back the driver to the HCL version |
LINT1 / NMI | Hardware: bad memory, failing CPU or PCIe card, check the server hardware logs |
| VMFS / heap exhaustion | Storage heap ran out, raise the heap setting or upgrade ESXi; rebalance large VMDKs |
PCPU N locked up | A CPU stuck in a driver/firmware spinlock, usually firmware; update BIOS and the implicated driver |
| Repeated after a recent change | The driver, firmware or VIB you just installed, roll it back |
If I had to bet on what's actually behind a PSOD in the wild, my money goes on a network or storage driver that doesn't line up with the ESXi build. It loves showing up right after an upgrade, where the inbox driver quietly shifted underneath you and nobody clocked it. Second place? Hardware, and usually that means memory. So read the exception line and figure out which family you're sitting in. Most of the diagnosis is already behind you at that point. What's left is mostly confirming the hunch.
Capture the coredump before you reboot
The coredump is the gold here. It's the thing that lets you, or VMware support once you open a ticket, pin down the exact instruction that blew up. Not a vague "something in the storage driver," the actual instruction. So before anything else, make sure there's somewhere for the host to write one:
esxcli system coredump partition list
esxcli system coredump partition get
# if none is set, configure the local diagnostic partition:
esxcli system coredump partition set --enable true --smart
# or send dumps to a network collector:
esxcli system coredump network set --interface-name vmk0 \
  --server-ipv4 10.0.0.50 --server-port 6500 --enable true
Got a dump? Good. Once the host is back, run vm-support to bundle it together with the logs that go with it. That one archive is what you hand to support. It spares you the "can you also send us the vmkernel log" reply, the one that always lands three emails deep.
Seriously, don't reboot a PSOD'd host until you've photographed the screen. The moment it cycles, that on-screen backtrace is gone for good. The only thing that survives the reboot is the coredump, and that's assuming one even got written in the first place.
Recover the host
The host is wedged. No graceful save here. Recovery means a clean restart, then the real work of figuring out why. In that order:
- Restart the host. Power-cycle it through the out-of-band controller (iLO, iDRAC, whatever your vendor badges it as), or walk over and do it by hand if you have to. The VMs come back up on it. Or HA restarts them somewhere else, assuming you set that up ahead of time.
- Make sure it came back clean. Run
esxcli system version get, then read/var/log/vmkernel.logfor whatever happened in the seconds right before the crash. That's usually where the breadcrumb's waiting. - Go after the cause. Update or roll back the driver the backtrace named (
esxcli software vib list | grep <driver>), push fresh firmware if it was a hardware fault, or bump the setting if you ran a heap dry. You already know which from the exception line. - If it crashes again right away, stop fighting it live. Drop the host into maintenance mode and pull the VMs off, so a crash loop isn't dragging your workloads down with it every five minutes.
Stop it happening again
- Live on the HCL. Run only the driver and firmware versions VMware actually lists against your exact ESXi build. Not the newest one, the listed one. I keep harping on this because most of the PSODs I've chased trace right back to someone wandering off it.
- Never run a host without a dump target. A PSOD that wrote nothing is an outage you paid for and learned nothing from, and that one stings. Set up a partition or a network dump collector on every single host, no exceptions.
- Move firmware and drivers as a pair. Use your server vendor's ESXi custom image or addon so the two stay in lockstep. Updating one and forgetting the other is basically how you manufacture your next purple screen.
- Test the memory on any host that went down with a hardware NMI before you trust it with production again. A reboot that "fixes" it just means the bad DIMM is sitting there, waiting for you.
- Keep ESXi reasonably current. Newer builds quietly nudge heap limits up and patch the nastier driver-interaction bugs, so a good chunk of the problems on this page just stop showing up.
Sources and further reading
Frequently asked questions
Is a PSOD always a VMware bug?
Almost never, and I'll happily take that bet. The vast majority come down to a third-party driver that doesn't match the ESXi build, or hardware on its way out (usually memory). ESXi only halts to keep your data safe, and it drops the actual offender right there on the screen for you. So start by treating it as a driver or hardware problem, not a VMware one. You'll be right far more often than you're wrong.
What does #PF Exception 14 mean on a PSOD?
It's a page fault. A kernel module reached for memory it had no right to touch. That's the textbook fingerprint of a buggy or mismatched driver, and honestly it's the one I run into most. Whatever module sits at the top of the backtrace is your target. Update it, or roll it back to the version the VMware Compatibility Guide says belongs on your build.
How do I find the cause if there is no coredump?
No dump means you're working with less, but not nothing. You lean on the photo you took (exception type, plus that top backtrace frame) and on /var/log/vmkernel.log from just before it went down. Often that's enough to name the family. Then, and I do mean today rather than when there's time, set up a coredump partition or a network collector. Next time you get the full picture instead of a guessing game.
Can I recover the VMs that were running on the host?
They went down hard when the host froze. Think yanking the power cord, not a clean shutdown. Once the host is back they boot again on it, or vSphere HA brings them up on another host if you've got HA running, and they come back to their last written-out state. The only thing you actually lose is in-flight I/O that never made it to disk. So yeah, HA plus storage you trust quietly earns its keep on a bad day.
What is the difference between a PSOD and a host showing Not Responding?
Night and day, even though both feel like the host is gone. A PSOD is a hard kernel halt. Purple screen, console frozen, the VMkernel is done. Not responding in vCenter usually means the host is alive and fine, but its management agent lost the thread, which is a much gentler problem you can often clear without rebooting a thing. The tell is the console. Pull up the physical or remote one and you'll know in about two seconds which one you're staring at.
How do I configure a coredump target on ESXi?
Want it local? Run esxcli system coredump partition set --enable true --smart and you're set. Prefer a central collector for a whole cluster? That's esxcli system coredump network set with the collector's IP and port. Either way, confirm it stuck with esxcli system coredump partition get. Don't just assume. And do this on every host while everything's calm, because finding out it was never configured, mid-crash, is about the worst time to find out.